Leonardo M. Millefiori, Paolo Braca, Dimitris Zissis, Giannis Spiliopoulos, Stefano Marano, Peter K. Willett, and Sandro Carniel, “COVID-19 Impact on Global Maritime Mobility,” Scientific Reports (NATURE), 2021.
In the attempt to control the outbreak of COVID-19, many countries all around the world went into full lockdown, imposing unprecedented containment measures. These restrictions progressively produced changes to social behavior and global mobility patterns, disrupting significantly economic activities.
A team of scientists form the Centre for Maritime Research and Experimentation (NATO STO CMRE), in collaboration with MarineTraffic, the world’s leading provider of ship tracking and maritime intelligence, the University of the Aegean (Greece), the University of Connecticut (USA) and the University of Salerno (Italy), focused on the quantitative analysis of these effects.
By analizing an extremely large set of maritime traffic data collected through the global network of Automatic Identification System (AIS) receivers, CMRE scientists coordinated the study of the impact caused by the COVID-19 pandemic on the shipping industry, which is responsible for more than 80% of the global trade.
The analysis published on Nature Scientific Reports, highlights an unprecedented drop in maritime mobility, across all categories of commercial shipping. With few exceptions, a generally reduced activity was observed from March to June in 2020, when the most severe restrictions were in force. Since the phenomena was not geographically homogenous, traffic density maps have been generated to understand the spatial distribution of significant mobility variations.
The work represents a fundamental step towards understanding global maritime effects due to COVID-19, and plan accordingly for correct resilience strategies to future shocks.
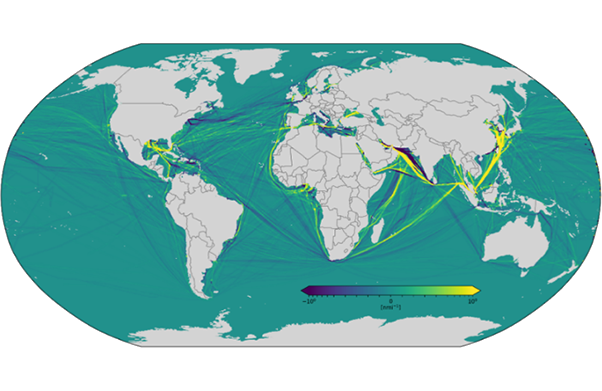
Cumulative Navigated Miles (CNM) density difference between 2020 and 2019 for wet bulk. The considered time period is from 13 March to 13 April. Each grid cell is colored based on the variation of the 2020 value with respect to 2019, ranging from dark purple, which represents a decrease of CNM in 2020 with respect to 2019, to bright yellow, which represents instead an increase of navigated miles in 2020 with respect to the previous year.
Read more: https://www.nature.com/articles/s41598-021-97461-7 Published by STO | 
